

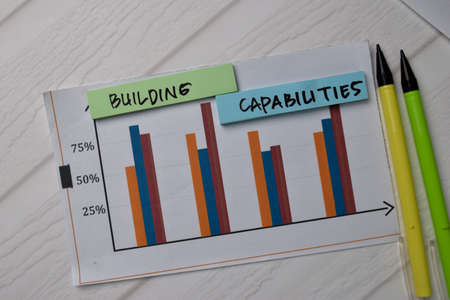
Child's hand arranging wood blocks in a step stair concept. Concept for growth, strategy, success process or investment goals.
Коллекция по умолчанию
Коллекция по умолчанию
Создать новую
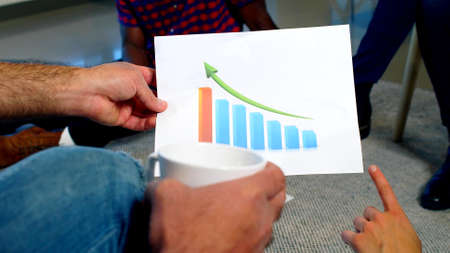
Short Term text on sticky notes isolated on office desk
Коллекция по умолчанию
Коллекция по умолчанию
Создать новую

Statistical financial graph predicting an economic depression after a 2020 global coronavirus pandemic.
Коллекция по умолчанию
Коллекция по умолчанию
Создать новую
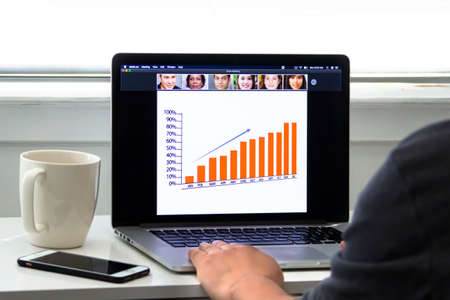
Calgary Alberta, Canada. May 25 2020. An office worker working from home having a Zoom meeting call looking at a presentation on a Macbook with a iPhone plus and a coffee.
Коллекция по умолчанию
Коллекция по умолчанию
Создать новую
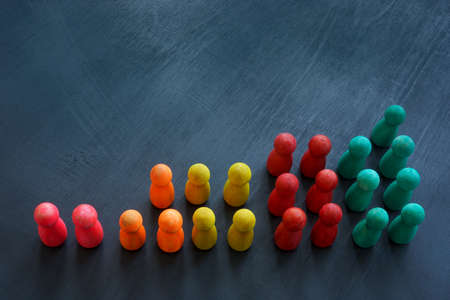
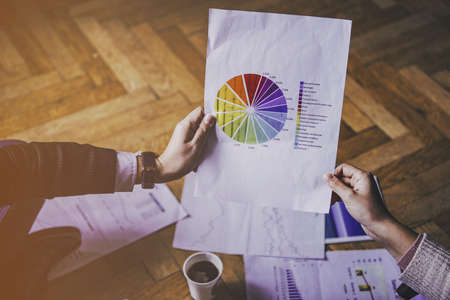
Market segmentation and targeting concept. Color figures on the desk.
Коллекция по умолчанию
Коллекция по умолчанию
Создать новую

Online stock exchange application with information on screen, closeup
Коллекция по умолчанию
Коллекция по умолчанию
Создать новую
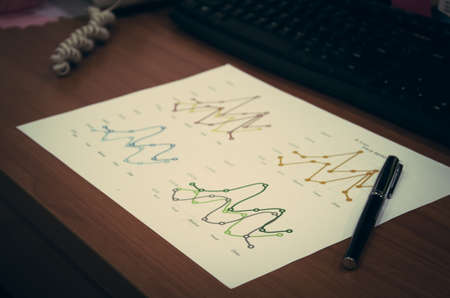
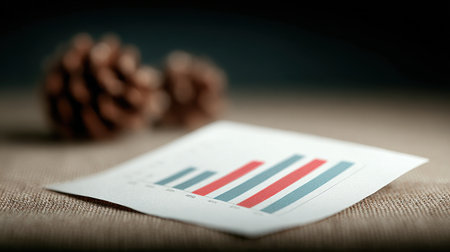
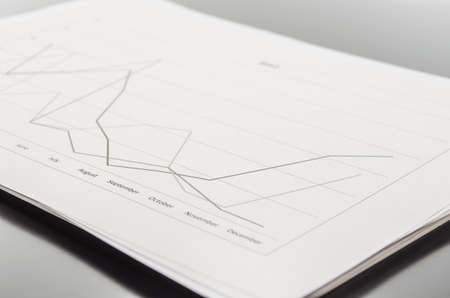
Line graph on desk and pen. Vintage filter
Коллекция по умолчанию
Коллекция по умолчанию
Создать новую
Monthly percentage bar chart showing financial comparison of 2026 budget versus actual performance data displayed on digital screen. Results tracking.
Коллекция по умолчанию
Коллекция по умолчанию
Создать новую
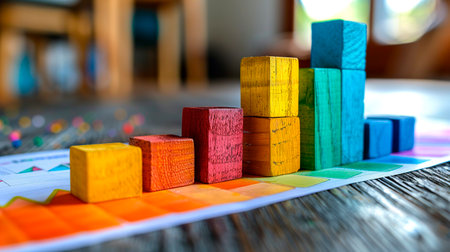
A colorful wooden block with an arrangement of stair or graph.
Коллекция по умолчанию
Коллекция по умолчанию
Создать новую
Businessman hand holding a document. Scenes white background.
Коллекция по умолчанию
Коллекция по умолчанию
Создать новую
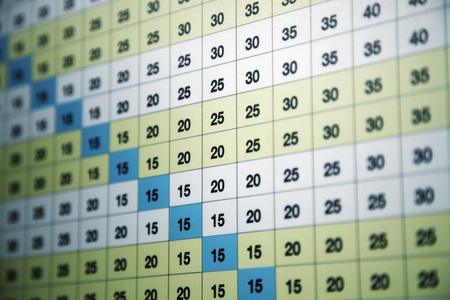
Close-up of a chart with numbers
Коллекция по умолчанию
Коллекция по умолчанию
Создать новую

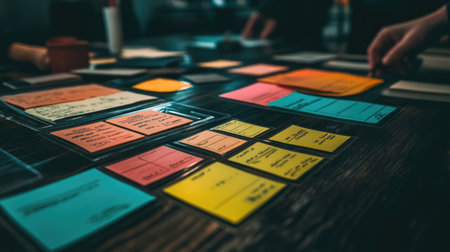
Colorful sticky notes scattered on a dark surface represent brainstorming and organization in a modern office setting, showcasing creativity and collaborative planning.
Коллекция по умолчанию
Коллекция по умолчанию
Создать новую
A bar chart displaying quarterly revenue growth for a successful business, with colorful bars rising high.
Коллекция по умолчанию
Коллекция по умолчанию
Создать новую
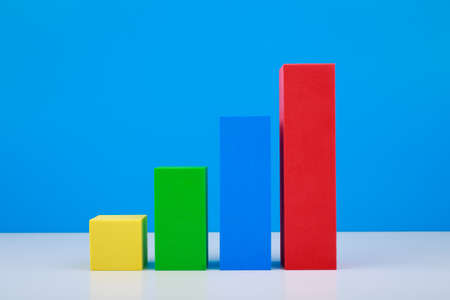
Business graph diagram with multicolored bars with rise dynamic against blue background
Коллекция по умолчанию
Коллекция по умолчанию
Создать новую

Team work with results and reports
Коллекция по умолчанию
Коллекция по умолчанию
Создать новую

heart on wooden cubes arranged in bar graph shape on blue background, health concept
Коллекция по умолчанию
Коллекция по умолчанию
Создать новую

A visually engaging workspace featuring colorful push pins and sticky notes on graph paper, illustrating data representation and enhancing creative organization for projects.
Коллекция по умолчанию
Коллекция по умолчанию
Создать новую
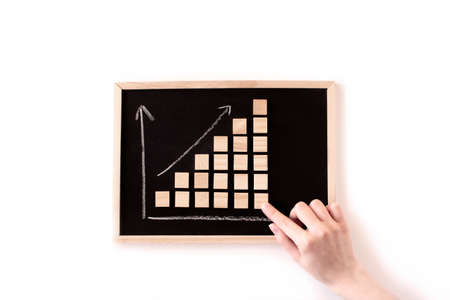
Chalkboard with ladder made of wooden blocks arrows up. Increase, rise, grow up. Business statistic. Career, money, success. Financial progress step by step on stacking blocks. Business flat lay.
Коллекция по умолчанию
Коллекция по умолчанию
Создать новую

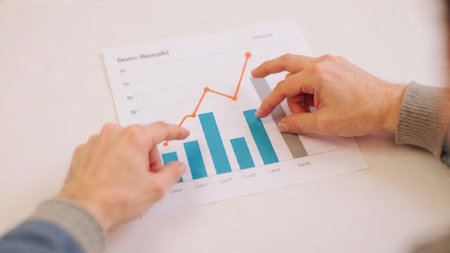
The business plan at the meeting and analyze financial numbers to view the performance of the company.
Коллекция по умолчанию
Коллекция по умолчанию
Создать новую
Colorful wooden blocks in a row on the background of a graph
Коллекция по умолчанию
Коллекция по умолчанию
Создать новую

Shallow depth of field (selective focus) with details of a chart showing the stock market crash from March 2020 due to the Covid-19 pandemic on a computer screen (S&P500 index)
Коллекция по умолчанию
Коллекция по умолчанию
Создать новую
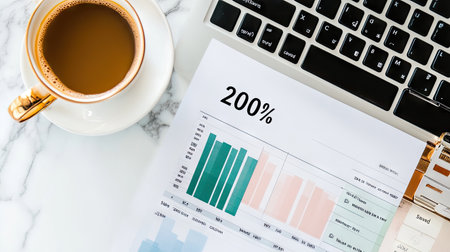
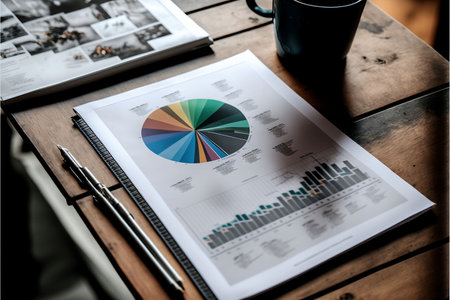
A modern workspace scene featuring a cup of coffee beside a laptop, with charts and graphs showcasing data analysis for productivity and business growth.
Коллекция по умолчанию
Коллекция по умолчанию
Создать новую
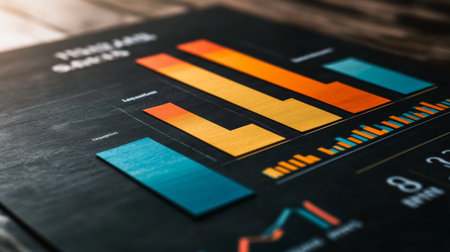
A vibrant bar chart displayed on a dark surface, showcasing data analysis and statistical trends, ideal for business presentations and reports.
Коллекция по умолчанию
Коллекция по умолчанию
Создать новую
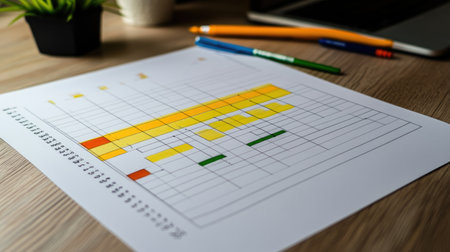
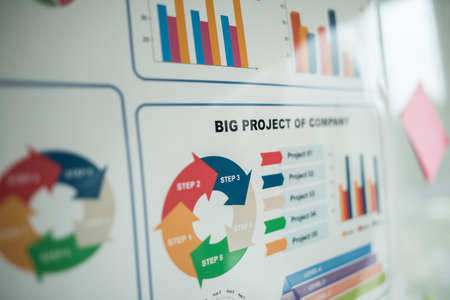
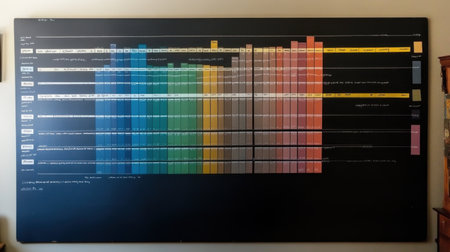
A vibrant project timeline chart displayed on a wooden desk, surrounded by stationery and a laptop, illustrating effective planning and management for teams.
Коллекция по умолчанию
Коллекция по умолчанию
Создать новую
An AI generated illustration of project management graphs charts paper
Коллекция по умолчанию
Коллекция по умолчанию
Создать новую
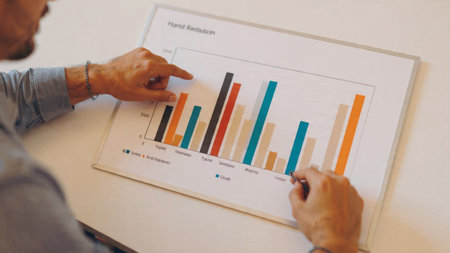
An office worker shows his colleagues a presentation with a company development graph at night on the company's computer
Коллекция по умолчанию
Коллекция по умолчанию
Создать новую
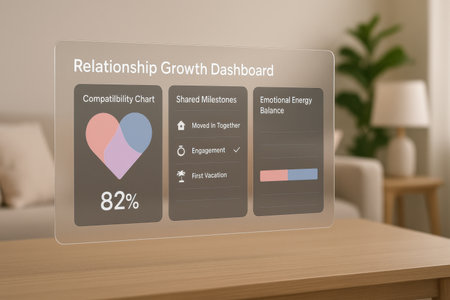
Digital composite of Dating App Interface on table in living room. 3D rendering
Коллекция по умолчанию
Коллекция по умолчанию
Создать новую

Wood bar block or yellow and black colour with line around. Top view
Коллекция по умолчанию
Коллекция по умолчанию
Создать новую
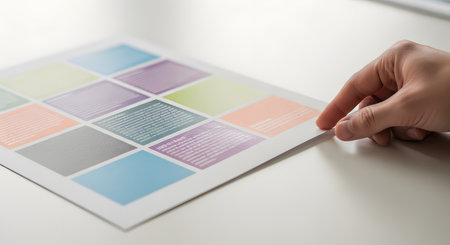
A hand lifts the corner of a high-quality printed document featuring a grid of colored squares with sample text. This represents a proof sheet for checking colors and layout in graphic design or printing.
Коллекция по умолчанию
Коллекция по умолчанию
Создать новую
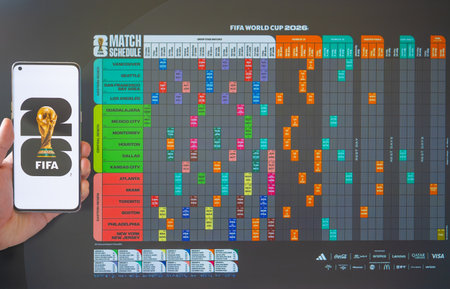
Zhongshan China-January 25 2026: Mobile with a FIFA World Cup Trophy photo and monitor with World Cup match schedule.
Коллекция по умолчанию
Коллекция по умолчанию
Создать новую

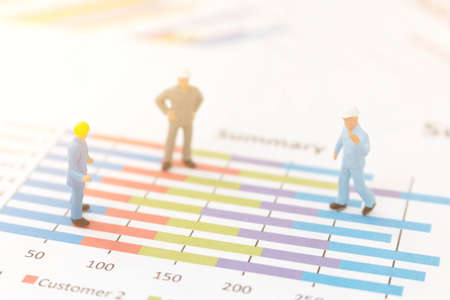
Businessmen miniature figure standing on investment and profit graph for analysis and discussion.
Коллекция по умолчанию
Коллекция по умолчанию
Создать новую

Close-up of a stock market analysis chart with a mix of bar graphs and line graphs highlighting key data
Коллекция по умолчанию
Коллекция по умолчанию
Создать новую

A vibrant display of pastel color swatches arranged on a light background, ideal for exploring color combinations and creative design concepts. Perfect for artists and designers.
Коллекция по умолчанию
Коллекция по умолчанию
Создать новую
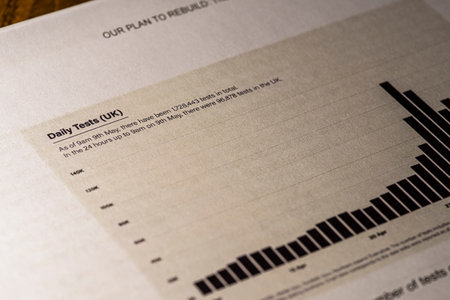
London, UK - May 11th 2020: Daily Tests heading in the document Our Plan To Rebuild - the UK Governments COVID-19 recovery strategy.
Коллекция по умолчанию
Коллекция по умолчанию
Создать новую
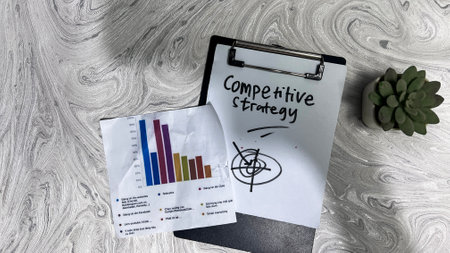
Concept of Competitive Strategy write on paperwork isolated on Wooden Table.
Коллекция по умолчанию
Коллекция по умолчанию
Создать новую
Small team working together with business reports
Коллекция по умолчанию
Коллекция по умолчанию
Создать новую
Business woman hands analyze diagram graph show financial charts information in office table. Close up female executive explaining presenting marketing data on conference. Corporate analysis concept.
Коллекция по умолчанию
Коллекция по умолчанию
Создать новую

3d render graph over gray background, rainbow business infographic, panoramic layout
Коллекция по умолчанию
Коллекция по умолчанию
Создать новую

Colorful wooden blocks on the table in the office, business concept
Коллекция по умолчанию
Коллекция по умолчанию
Создать новую
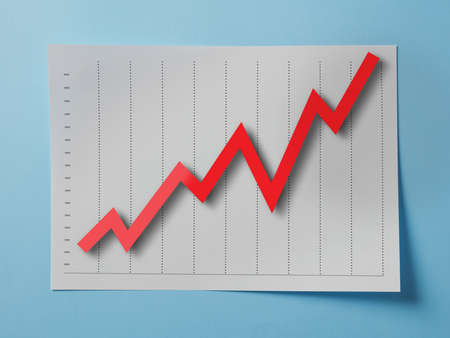
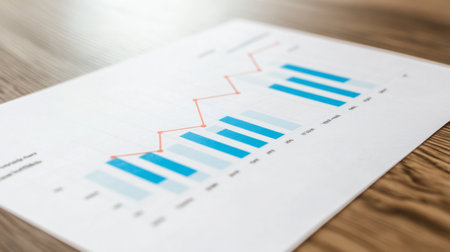
A piece of paper with a graph on it is on a table. The graph is a bar chart with a red and blue line. The paper is crumpled and has a few creases
Коллекция по умолчанию
Коллекция по умолчанию
Создать новую

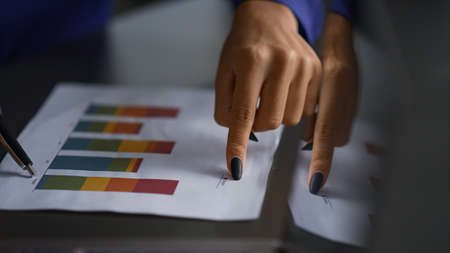
Analysis of data from graphs. select focus.
Коллекция по умолчанию
Коллекция по умолчанию
Создать новую
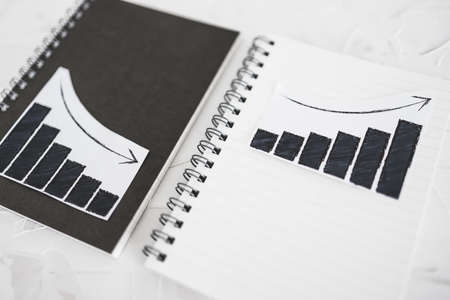
business analysis and statistics concept, positive and negative trends on graphs on notebooks side by side
Коллекция по умолчанию
Коллекция по умолчанию
Создать новую

Sales profit numbers changing on monitor after global trade, real time exchange market stocks statistics growing. Financial graphs showing money trend, risk buying. Close up. Tripod shot.
Коллекция по умолчанию
Коллекция по умолчанию
Создать новую
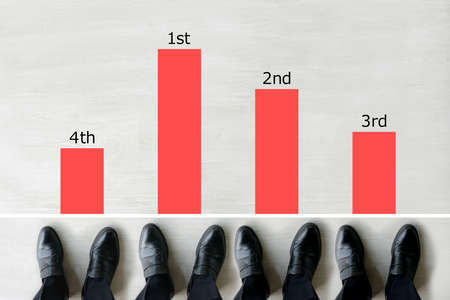
Image of businessman's business performance and annual income graph and ranking
Коллекция по умолчанию
Коллекция по умолчанию
Создать новую

Wooden Blocks Connected in a Network Showing Various Technology Icons, generative Ai
Коллекция по умолчанию
Коллекция по умолчанию
Создать новую

Office employees discussing business figures on white board
Коллекция по умолчанию
Коллекция по умолчанию
Создать новую

Close-up of male hand holdig blue clipboard with chart as profit data analysis concept with copy space
Коллекция по умолчанию
Коллекция по умолчанию
Создать новую

Circle with numbers
Коллекция по умолчанию
Коллекция по умолчанию
Создать новую
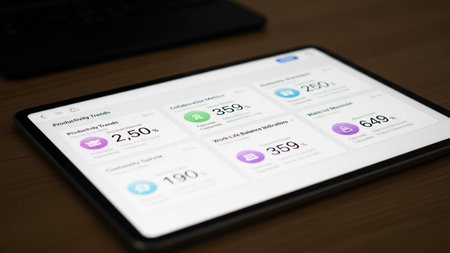
This image shows a tablet device displaying a digital dashboard with various health metrics. The dashboard includes sections for productivity trends, caloric intake, sleep monitoring, work-life balance scores, and step counts. Each section has a visual representation, such as graphs and icons, to provide a clear overview of the user's health and productivity data.
Коллекция по умолчанию
Коллекция по умолчанию
Создать новую
Stock market business graph chart on digital screen
Коллекция по умолчанию
Коллекция по умолчанию
Создать новую

Close-up view of a laptop displaying data analysis with charts and graphs, perfect for showcasing technology, finance, or business analytics themes.
Коллекция по умолчанию
Коллекция по умолчанию
Создать новую

A stock market graph on a black background.
Коллекция по умолчанию
Коллекция по умолчанию
Создать новую

Miniature people standing on colorful wooden blocks with copy space for text
Коллекция по умолчанию
Коллекция по умолчанию
Создать новую

Virus pandemic covid-19 map on pc screen, global infection, internet.
Коллекция по умолчанию
Коллекция по умолчанию
Создать новую

working economist financial analytics papers
Коллекция по умолчанию
Коллекция по умолчанию
Создать новую
Businessman standing on a graph chart
Коллекция по умолчанию
Коллекция по умолчанию
Создать новую
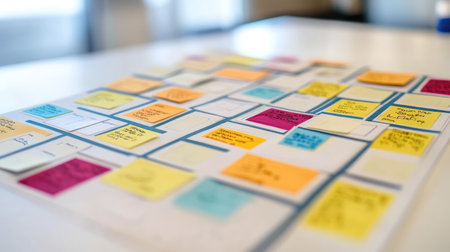
A vibrant collection of sticky notes and papers arranged on a wooden table showcases a collaborative brainstorming session in a contemporary office. Hands actively engage.
Коллекция по умолчанию
Коллекция по умолчанию
Создать новую

ballpoint pen indicates income graphs lying on the table
Коллекция по умолчанию
Коллекция по умолчанию
Создать новую
on the chalkboard sign woman, man graphic, sexually active, frigid
Коллекция по умолчанию
Коллекция по умолчанию
Создать новую

Close up making agenda Daily schedule on personal organizer. Business and entrepreneur concept. Isolated on a black background
Коллекция по умолчанию
Коллекция по умолчанию
Создать новую
A work meeting in a start-up
Коллекция по умолчанию
Коллекция по умолчанию
Создать новую
business documents over papers with numbers and charts. View from above
Коллекция по умолчанию
Коллекция по умолчанию
Создать новую
A vibrant assortment of colorful sticky notes sprawled across a white table, showcasing a dynamic brainstorming and planning session that stimulates collaboration and creativity.
Коллекция по умолчанию
Коллекция по умолчанию
Создать новую

Crypto Currency market concept. Bank market and virtual currency value graph. Statistics comparison of best-selling crypto coins on stock exchange. Use for Bitcoin, ETH, Ripple, Bitcoin cash.
Коллекция по умолчанию
Коллекция по умолчанию
Создать новую

Business financial or stock market background. Business graph on stock market financial exchange
Коллекция по умолчанию
Коллекция по умолчанию
Создать новую

Blue and pink cubes. The concept of sexism, feminism and equality. Soft focus
Коллекция по умолчанию
Коллекция по умолчанию
Создать новую
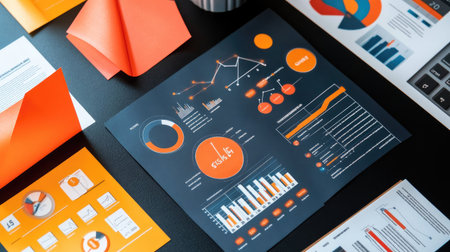
A vibrant collection of data visualization elements including colorful charts and graphs arranged on a dark surface, ideal for business analysis and presentation needs.
Коллекция по умолчанию
Коллекция по умолчанию
Создать новую
A trading dashboard lights up the laptop while economic reports and a hot coffee sit beside it on a wooden surface.
Коллекция по умолчанию
Коллекция по умолчанию
Создать новую
This image features a colorful segmented circle design against a dark background, perfect for creative projects, educational materials, or graphic designs.
Коллекция по умолчанию
Коллекция по умолчанию
Создать новую
A neat financial desk with live candlestick graphs, economic reports, and a coffee mug.
Коллекция по умолчанию
Коллекция по умолчанию
Создать новую

diagram pointing down. decline drop reduction concept. exponential curve on dark blue backdrop.
Коллекция по умолчанию
Коллекция по умолчанию
Создать новую

Graphs and Charts. Flowcharts. Statistic. Macro. Blue color.
Коллекция по умолчанию
Коллекция по умолчанию
Создать новую
A close-up of a business report with colorful bar and line graphs.
Коллекция по умолчанию
Коллекция по умолчанию
Создать новую

Hand turns a dice and changes the year 2020 to 2021.
Коллекция по умолчанию
Коллекция по умолчанию
Создать новую
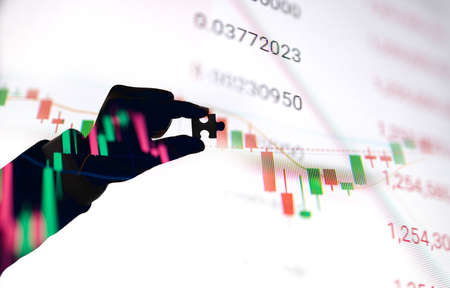
Double Exposure Silhouette of hand hold jigsaw with stock market pricelist graph. Concept for business and finactial economy.
Коллекция по умолчанию
Коллекция по умолчанию
Создать новую
This image features colorful wooden blocks arranged in ascending order, representing growth and analysis in business metrics and statistics. Perfect for visualizing progress.
Коллекция по умолчанию
Коллекция по умолчанию
Создать новую

Business plan documents and charts for eco-tourism startup on rustic wooden table
Коллекция по умолчанию
Коллекция по умолчанию
Создать новую

Flat lay of twelve zodiac signs. Horoscope concept, top view
Коллекция по умолчанию
Коллекция по умолчанию
Создать новую

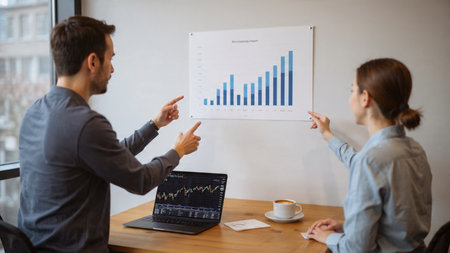
Engaging collaboration between a young woman and an older man as they analyze data on a smartphone against a vibrant presentation board in a modern office.
Коллекция по умолчанию
Коллекция по умолчанию
Создать новую

Charts Graphs paper. Financial development, Banking Account, Statistics, Investment Analytic research data economy, Stock exchange Business office company meeting concept.
Коллекция по умолчанию
Коллекция по умолчанию
Создать новую
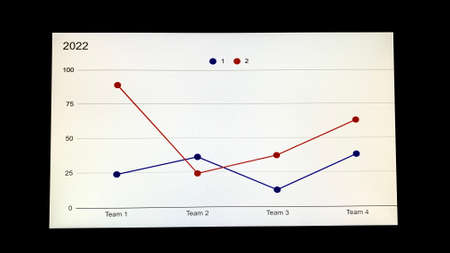
This vibrant data visualization chart presents a colorful analysis of various statistical categories, featuring clear trends over time in an engaging manner.
Коллекция по умолчанию
Коллекция по умолчанию
Создать новую

A modern astrologers gadget. A smartphone with a clients astrological chart.
Коллекция по умолчанию
Коллекция по умолчанию
Создать новую

colorful, five rainbow colored sponges on blue background
Коллекция по умолчанию
Коллекция по умолчанию
Создать новую

Colorful wooden blocks stacking as step stair. Business growth concept.
Коллекция по умолчанию
Коллекция по умолчанию
Создать новую
Diverse wooden figures help each other up a colorful block staircase in office
Коллекция по умолчанию
Коллекция по умолчанию
Создать новую
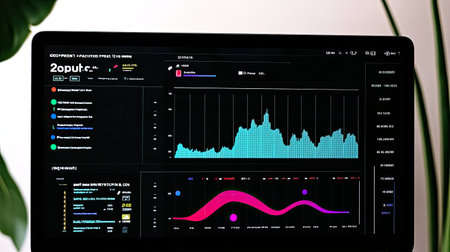
A sleek digital dashboard showcasing market analysis with engaging charts. Ideal for professionals seeking insights into financial performance and trends.
Коллекция по умолчанию
Коллекция по умолчанию
Создать новую
A business growth chart displayed on a wooden table represents data analysis and strategic planning. Ideal for finance and marketing themes.
Коллекция по умолчанию
Коллекция по умолчанию
Создать новую

list of post pandemic economical recession keywords next to graph with negative stats, concept of inflation and shortages
Коллекция по умолчанию
Коллекция по умолчанию
Создать новую
A simple yet powerful image showcasing a framed chart with an upward trend. a potted plant. and a pen. This image symbolizes growth. success. and productivity. perfect for business and marketing presentations.
Коллекция по умолчанию
Коллекция по умолчанию
Создать новую
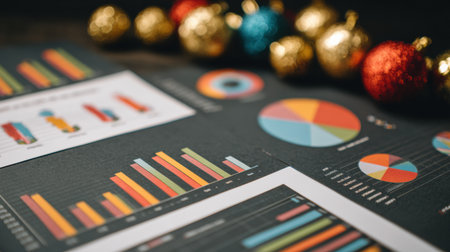
Charts and graphs display data insights on a table, while vibrant holiday ornaments add a festive touch to the workspace, creating a cheerful atmosphere.
Коллекция по умолчанию
Коллекция по умолчанию
Создать новую
Graph document on a black table
Коллекция по умолчанию
Коллекция по умолчанию
Создать новую

Artistic display of white frames on wire mesh for creative decor inspiration
Коллекция по умолчанию
Коллекция по умолчанию
Создать новую
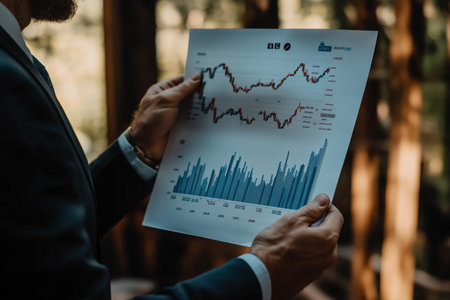
Business professional analyzing financial data in a forest setting during daylight hours
Коллекция по умолчанию
Коллекция по умолчанию
Создать новую

Stock market or forex trading graph in graphic concept suitable for financial investment or Economic trends business idea and all art work design.
Коллекция по умолчанию
Коллекция по умолчанию
Создать новую
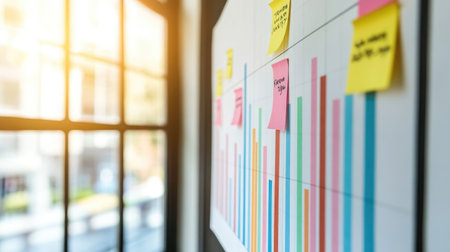
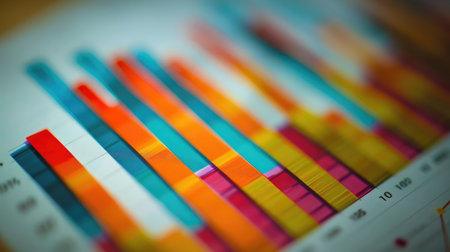
A detailed bar graph display featuring colorful sticky notes that illustrates data analytics in a modern office setting, symbolizing creativity and strategic planning.
Коллекция по умолчанию
Коллекция по умолчанию
Создать новую

Businesswoman holding a notepad at her desk, a group of businessmen attending a meeting and holding meeting materials, brainstorming meeting to plan a company's growth. Business meeting idea.
Коллекция по умолчанию
Коллекция по умолчанию
Создать новую

Financial stock market graph. Stock Exchange. Selective focus.
Коллекция по умолчанию
Коллекция по умолчанию
Создать новую
Wooden desk reflecting financial activity with laptop charts and printed analysis.
Коллекция по умолчанию
Коллекция по умолчанию
Создать новую
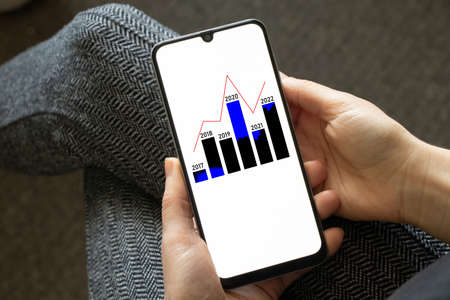
a histogram with columns and years on the screens of a mobile phone in the hands of a girl, an analysis of the years from 2017 to 2022, a sub-view of the totals, a histogram
Коллекция по умолчанию
Коллекция по умолчанию
Создать новую

Graph of market share with black pen in business concept
Коллекция по умолчанию
Коллекция по умолчанию
Создать новую
Legion-Media
Создайте свои проекты на основе качественных стоковых фотографий и видео.


Copyright © Legion-Media.